

Finance teams are under pressure in 2026 to do more with less, leverage Artificial Intelligence (AI) to run leaner operations, and prove their value to impatient CEOs and boards. But without reliable benchmarking data, many finance leaders end up managing the size of their team using gut feel.
Looking for Finance FTE benchmarks? Search database
One of the sharpest metrics for separating world-class finance functions from those that are overweight is the number of Finance FTEs per $1B in Revenue. An APQC benchmarking study on CFO.com stated 36 FTE per $1B in revenue for companies in the 25th percentile compared to 141.6 FTEs for companies in the 75th percentile. This difference is nearly four times, which can add up to hundreds of people and millions of dollars each year.

The number of Finance FTEs per $1B in Revenue is a simple but powerful measure. It tells you how many full-time employees (FTEs) in your finance function are required to support one billion dollars in company revenue. By normalizing finance headcount against revenue size, the ratio provides a clear indicator of efficiency, scalability, and organizational leverage.
The calculation itself is relatively straightforward:
Finance FTEs ÷ Annual Revenue (in billions) = Finance FTEs per $1B in Revenue
For example, a company with $4B in annual revenue and 480 finance FTEs has:
480 Finance FTEs ÷ 4 billion dollars annual revenue = 120 FTEs per $1B revenue
What matters most is defining which roles to count as “Finance.” APQC includes all finance function employees responsible for planning, budgeting, accounting, tax, treasury, internal audit, and compliance. Many companies miss this by excluding local controllers or staff embedded in business units, which skews benchmarks. If you’re benchmarking, definition consistency is crucial.
The main reason this metric has become so critical in 2026 is that AI is reshaping the finance function. Boards and CEOs are demanding that their organizations leverage AI to streamline processes and gain efficiencies relative to their competitors. This expectation means that finance leaders have to stay on top of their finance function relative to peers, and benchmarking Finance FTEs per $1B in Revenue is one of the best ways to stay ahead.
Ready to benchmark your Finance FTE? Get started now
The data is clear. PwC states that 30% – 40% of time can be reduced with finance automation and behaviour change. Hackett Group research also shows that "world-class" finance organizations operate at 35% lower cost and with approximately 30% fewer FTEs per $1B revenue than peers.
In an era of automation, AI, and ERP transformation, the finance FTE ratio is a leading indicator of whether your team is keeping up. If you’re above 120 FTEs per $1B, you’re likely carrying excess manual work, fragmented systems, or redundant processes. Investors and boards know it too, which is why many CFOs now use this ratio as part of their regular reporting.
Benchmarking isn’t just about finding a number - It’s about diagnosing why your number is what it is. Here’s a practical five-step approach to benchmarking your Finance FTEs per $1B in Revenue:
Decide which roles count as finance and be consistent with benchmark definitions. At CompanySights we include any employee who performs these activities:
Confirm your total finance FTEs per the definition outlined above, then divide by them by annual revenue (in billions) to calculate the ratio.
Research the median and quartile benchmarks for your industry, company size, and region. While there are lots of general finance benchmarks out there, it’s important to drill down as much as possible to ensure relevance. This is also the key to reaching agreement from the CEO and board.
At CompanySights, Finance leaders have access to 1M+ benchmarking data points to help them see how their finance function stacks up – Compare your finance function now.
Is your finance work fragmented across countries? Do you lack automation in accounts payables and receivables? Are you bogged down by regulatory requirements? The drivers tell you whether your ratio reflects inefficiency or just the reality for your industry.
If you’re above the median, put in place transformation levers: ERP upgrades, shared services, automation, or outsourcing. If you’re already top quartile, it's best to focus on reinvesting freed up capacity into higher-value finance activities and business partnering. Context is everything.

The difference between lean and heavy finance teams comes down to five core factors:
Highly regulated industries, such as banking, pharmaceuticals, and insurance naturally carry higher finance FTE ratios. This is due to heavier reporting, compliance, and audit requirements that add unavoidable workload.
Companies operating across dozens of countries need larger finance teams to handle local statutory reporting, tax filings, and multi-currency consolidation. For example, a $5B multinational will almost always need more finance FTEs compared to a $5B domestic firm.
This is the biggest lever. Companies with robust ERP, robotic process automation (RPA), and AI-powered tools can run with dramatically fewer staff. Data shows that digital world-class organizations process transactions with up to 50% fewer FTEs than peers (Hackett Group).
Decentralized finance functions, where each business unit runs its own processes, almost always inflate headcount. Centralized shared services or outsourcing models drive efficiency by consolidating transactional work.
Smaller companies often show higher FTE ratios because finance workloads don’t scale down linearly. For example, a $200M company may still need 40 – 50 finance staff to cover the basics, resulting in an artificially high ratio relative to the industry average across all company sizes.
Explore finance benchmarks specific to your industry, size, and geography
A $2B SaaS business operates with just 100 finance FTEs, which equates to 50 Finance FTE per $1B revenue. This is possible because subscription revenues are predictable, billing and collections are largely automated, and ERP systems streamline reporting. The finance team spends most of its time in FP&A and business partnering, not transaction processing.
A $10B manufacturing company employs 1,500 finance staff. This equals 150 Finance FTE per $1B revenue. Complexity drives the ratio upward: multi-entity consolidation, inventory accounting, tax requirements in 40+ countries, and local statutory reporting. Despite automation efforts, supply chain complexity keeps the finance FTE ratio above the median.
A $5B consumer goods company started with 1,000 finance FTEs equalling 200 Finance FTE per $1B revenue. However, they were able to reduce this to 100 per $1B after consolidating AP, AR, and GL into regional shared service centers and implementing SAP S/4HANA. By automating reconciliations and introducing global process ownership, the company halved its finance headcount and shifted staff into analytics.
A private equity-owned industrial company with $3B revenue inherited 180 Finance FTEs per $1B revenue after the acquisition. Within two years, they reduced that to 90 per $1B by outsourcing transactional finance to a BPO provider and rolling out standardized global processes. The leaner structure not only cut costs but also supported a faster exit multiple.
The landscape of the finance function is undergoing a profound transformation. Gartner states that the rise of agentic AI is expected to autonomously make at least 15% of daily decisions in finance. Then by 2030, 70% of finance functions will leverage AI for real-time decision-making, fundamentally altering the role of finance professionals.
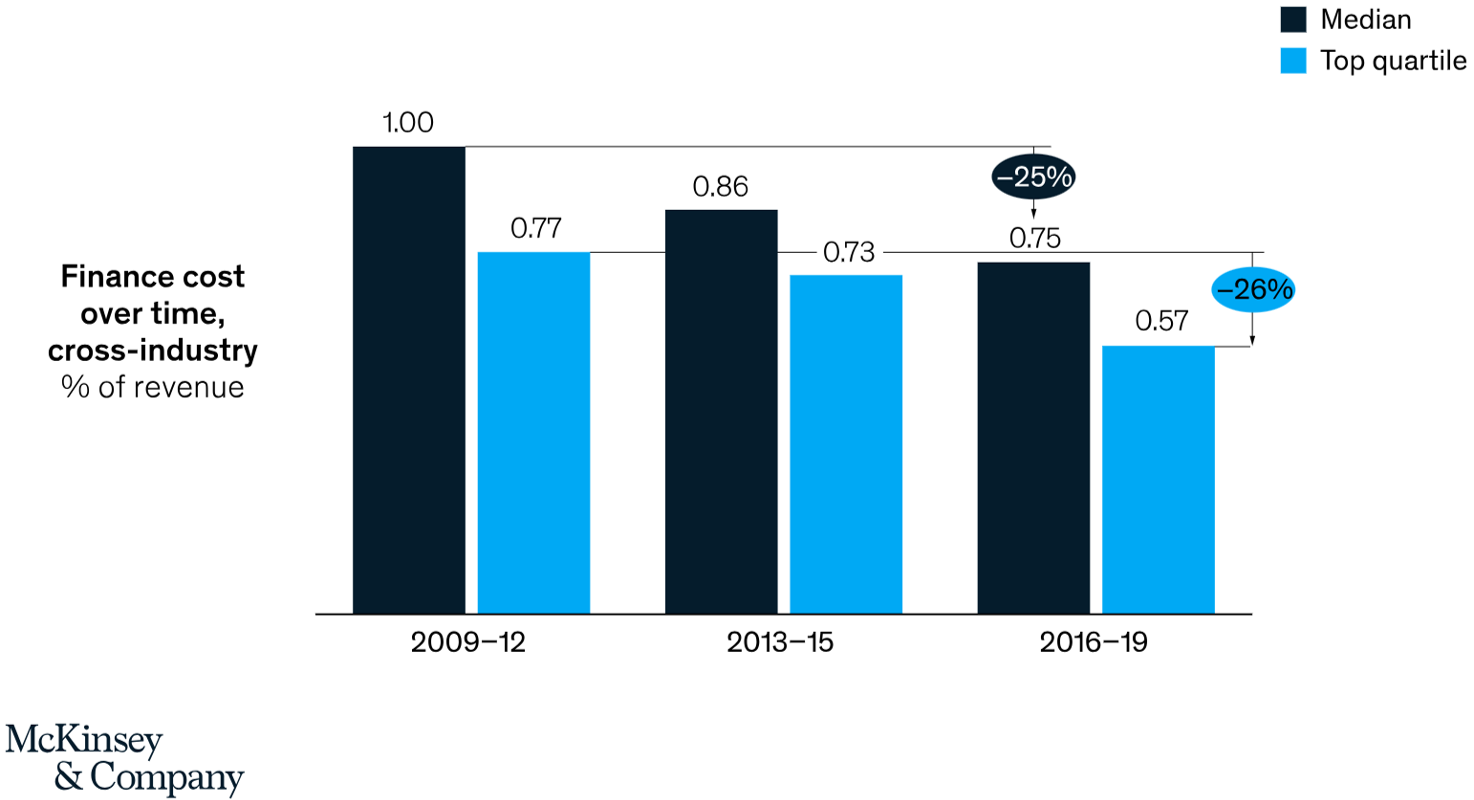
This shift is likely to be reflected in the Finance FTEs per $1B Revenue metric, with the expectation that it will decrease as the adoption of AI speeds up. This shift is already occurring when it comes to finance department costs, with McKinsey reporting that the median reduced from 1% of revenue in 2009-12 to 0.75% of revenue in 2016-19.
As we look towards the future, finance leaders will need to adapt by reskilling their teams, embracing AI-driven tools, and redefining performance benchmarks to align with a more agile and technology-driven finance function.
In 2026, the finance function has nowhere to hide. The gap between world-class and average is no longer 10 to 15% - It’s a massive 200%. If your ratio is above the median, you’re signalling inefficiency to your CEO, board, and investors. The finance leaders who succeed will be those who view Finance FTEs per $1B revenue as a leading indicator for sizing their workforce.
Access finance benchmarks for forward-thinking leaders
The median finance team size is 69.4 FTEs per $1B revenue. More efficient, top-quartile organizations operate at 36 FTEs per $1B, while bottom-quartile companies were 141.6 FTEs per $1B revenue. These figures are from APQC’s benchmarking survey, which are summarised on CFO.com and corroborated by CompanySights data.
For a $1B company, finance team size varies significantly by industry and complexity. Lean, automated businesses such as SaaS often operate with less finance FTEs, whereas complex, global businesses like manufacturing or financial services may require more. The “right size” depends heavily on compliance requirements, operational complexity, and the maturity of finance systems.
A good benchmark for finance headcount per $1B revenue is typically between 50 – 100 employees per $1B revenue. However, this range varies widely with the most meaningful comparison against peers in the same industry and company size, rather than against an all industry range.
World-class finance teams typically use around 30% fewer FTEs per $1B revenue. They achieve these results by leveraging shared services, automation, and advanced analytics, which allows them to spend more time on strategic business partnering rather than transactional work. It’s important to note that this gap is increasing with the adoption of Artificial Intelligence.
The size of a finance team is influenced by several factors, including industry regulations, the company’s global footprint, the level of technology adoption, the chosen operating model, and the maturity of the business.
Benchmarks vary widely by industry. For example, SaaS companies usually need fewer finance employees because their business models are highly scalable and much of their back-office work can be automated. On the other hand, manufacturing companies require larger finance teams to manage supply chain complexity, inventory, cost accounting, and regulatory compliance across multiple jurisdictions.
In 2024, best in class finance functions defined as “digital world class” operated with a total finance cost of 0.54% of revenue. In comparison, finance functions with “low data standards” had a total finance cost of 1.76% of revenue, reflecting companies with low levels of digitization (Hackett Group).
CFOs can automate transactional processes such as accounts payable, accounts receivable, and expense management. They can also centralize support through shared services or outsourcing, standardize core processes, and invest in analytics and FP&A tools to minimize manual reporting. Upskilling teams ensures that fewer people spend time on low-value tasks while maintaining performance standards.

.svg)
Download a copy of our latest all industry report with data to benchmark the Finance, HR, IT and Marketing functions.
Insights are just around the corner.
.svg)
.svg)


